Chart
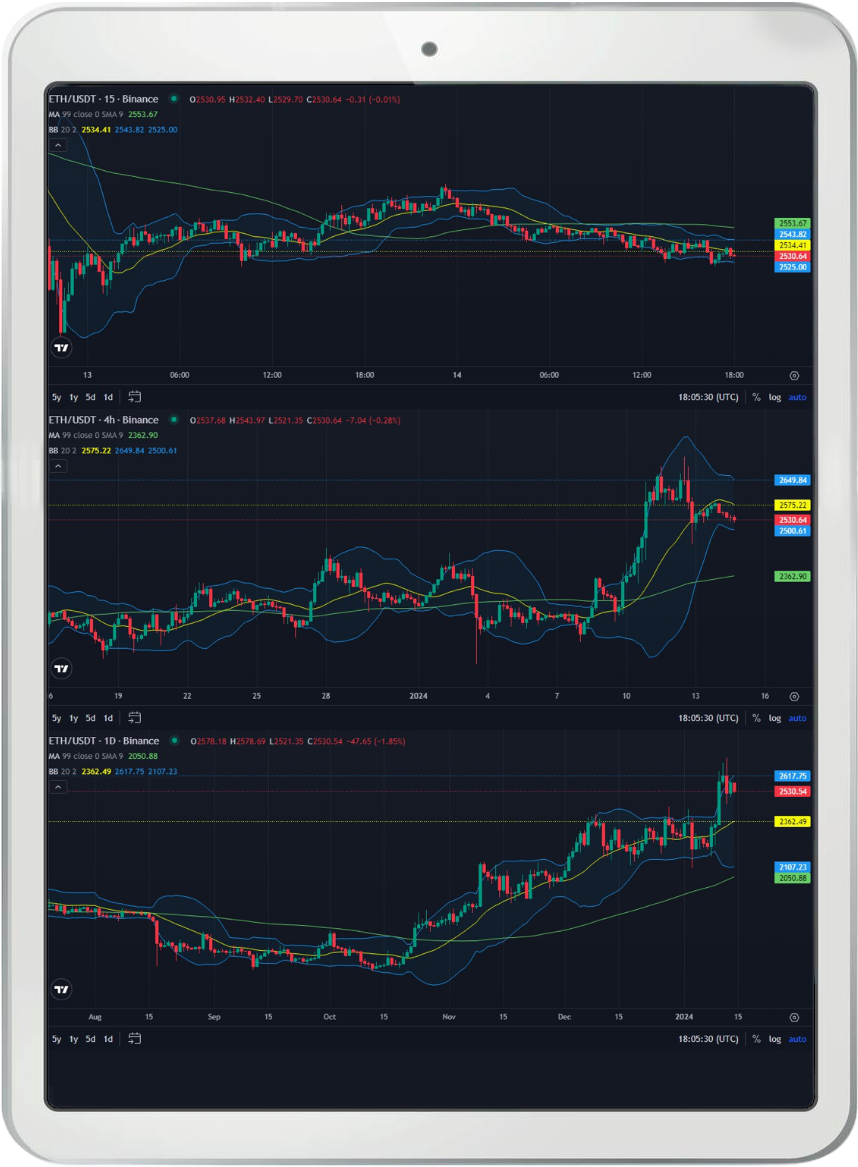
A command generates the latest TradingView chart for the specified market and candle. The indicators displayed: upper / lower / middle Bollinger Bands, 99 Moving Average. If no candle is specified, the three charts for the 15M, 4H, and 1D candles combined into one image will be sent. If the particular candle is selected, then one price chart is generated with an additional volume chart + RSI linear chart.
Chart with no candle specified

Chart with a candle specified

Available plans: Basic, Pro, Ultimate
Info
A command displays the extended information about the specified currency, such as price, Bollinger band indicators, market cap, 24H / 7D / 30D change, 24H volume, rank and list of companies related to it. The image of the combined TradingView chart for 15M, 4D, 1D intervals is sent as a separate message.

Available plans: Basic, Pro, Ultimate
Gainers / Losers
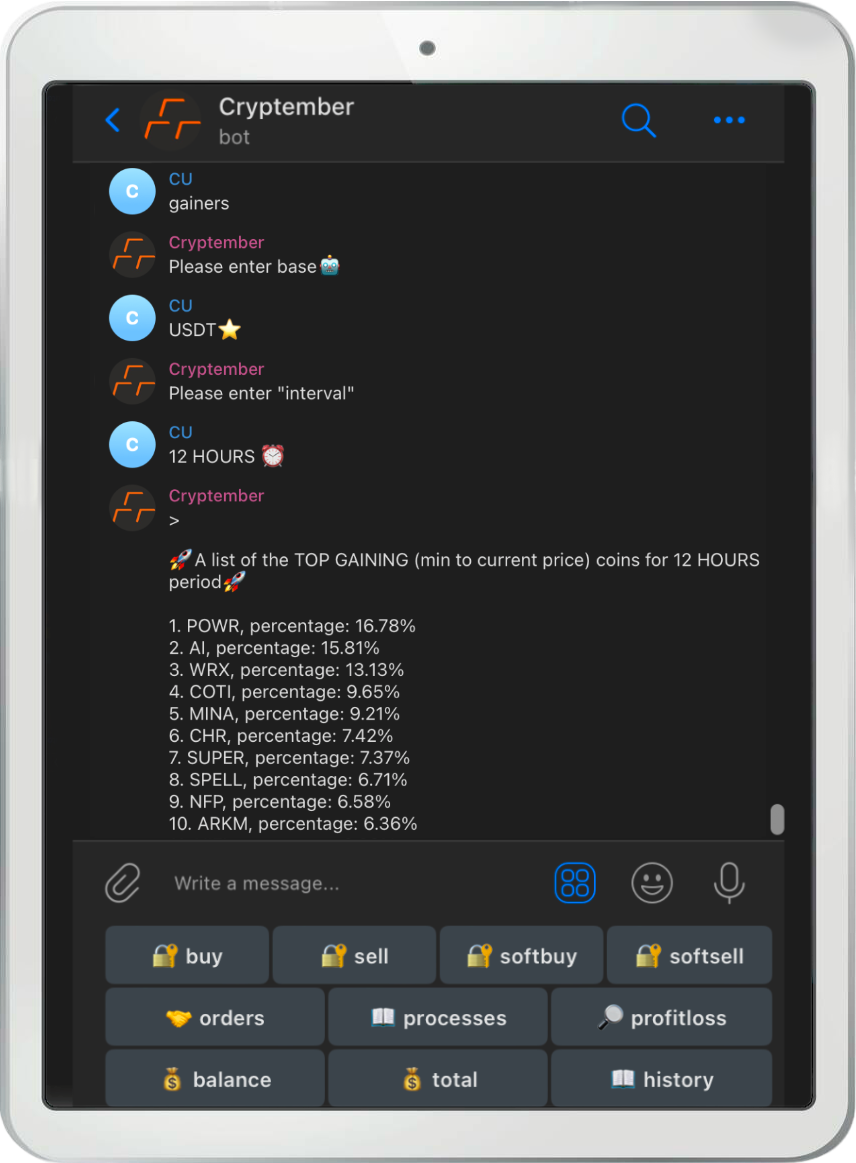
The commands display 30 best (gainers) / worst (losers) coins in terms of the price change within the specified period. The period of when to apply the calculations can be specified, the available items for it: 1 (or any other number) HOUR, 1 (or any other number) DAY, 1 (or any other number) Week.

Available plans: Pro, Ultimate
Watches
A command representing a menu to configure a watchlist for the currencies you are interested in. The available options are:
- Notify All – notify now the useful information across all of the watches
- My Watches – check the current watchlist items
- Watch – start a new watch for the currency (add a currency to the watchlist)
- Edit Watch – edit the note of the specified watch
- Enable Notifications / Disable Notifications
Available plans: Ultimate
Watch
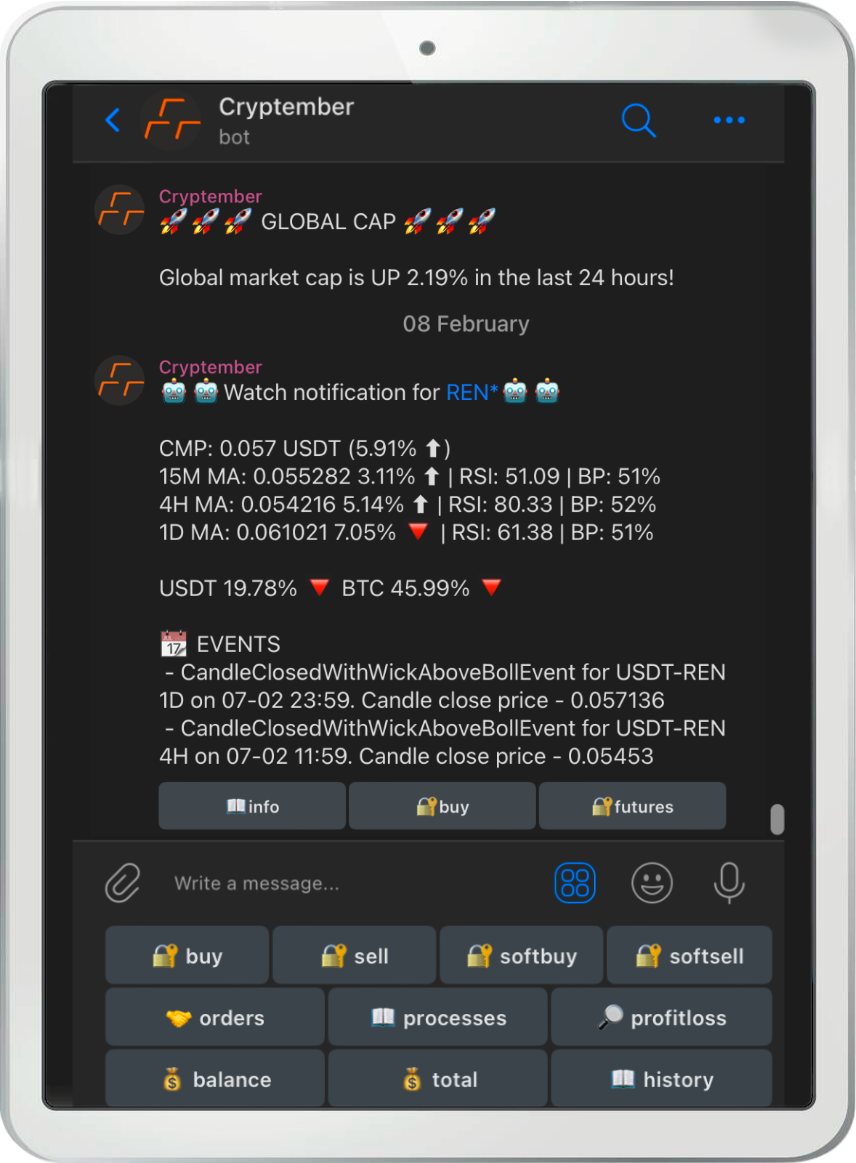
As mentioned before, a command is to start a new watch for a currency (add a currency to the watchlist). But what actually does that mean and why the command is a part of an Ultimate plan package? And the answer is – notifications! When an important market event occurs with the currency from a watchlist, you immediately receive notifications about it. The event list specified is very wide and becomes wider and wider with our new implementations but here is the list of such events at this moment:
- RSI / MFI divergence candidate
- Bullish / Bearish break of structure
- Market breakout / breakdown event
- Trend change event
- Candle closed with wick above / below the Bollinger band at one of the intervals (15M, 4H, 1D)
- Price is above the historical level

A watch is sent with three quick actions to immediately execute within it (info, buy, futures)
